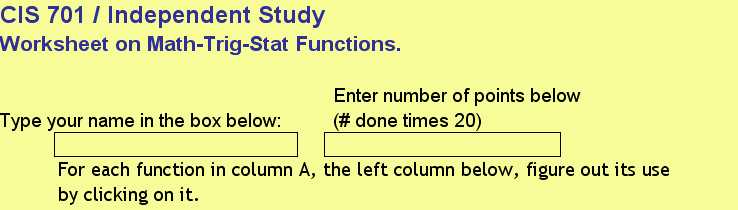
Directions. Access https://auciello.tripod.com/701-math-trig-stat.xls by clicking its name. This brings up
a worksheet that looks like:
Next click Help, Microsoft Excel Help. Type "Function" for keyword as I did below:
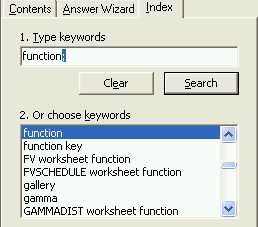 Open Excel, click Help, click Microsoft Excel
Help, and enter "function" as a Keyword, then click "function" ...
Open Excel, click Help, click Microsoft Excel
Help, and enter "function" as a Keyword, then click "function" ...
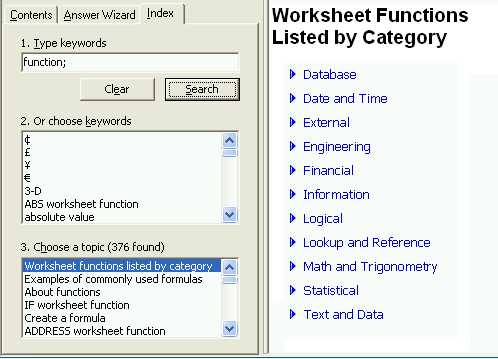
Then click "Math and Trignometry" ...
which gives the list on the left column below:
| List of Math and Trignometric Functions in EXCEL: | List of Statistical Functions in EXCEL: |
|
ABS Returns the absolute value of a number |
AVEDEV Returns the average of the absolute deviations of data points from their mean |
|
ACOS Returns the arccosine of a number |
AVERAGE Returns the average of its arguments |
|
ACOSH Returns the inverse hyperbolic cosine of a number |
AVERAGEA Returns the average of its arguments, including numbers, text, and logical values |
|
ASIN Returns the arcsine of a number |
BETADIST Returns the cumulative beta probability density function |
|
ASINH Returns the inverse hyperbolic sine of a number |
BETAINV Returns the inverse of the cumulative beta probability density function |
|
ATAN Returns the arctangent of a number |
BINOMDIST Returns the individual term binomial distribution probability |
|
ATAN2 Returns the arctangent from x- and y-coordinates |
CHIDIST Returns the one-tailed probability of the chi-squared distribution |
|
ATANH Returns the inverse hyperbolic tangent of a number |
CHIINV Returns the inverse of the one-tailed probability of the chi-squared distribution |
|
CEILING Rounds a number to the nearest integer or to the nearest multiple of significance |
CHITEST Returns the test for independence |
|
COMBIN Returns the number of combinations for a given number of objects |
CONFIDENCE Returns the confidence interval for a population mean |
|
COS Returns the cosine of a number |
CORREL Returns the correlation coefficient between two data sets |
|
COSH Returns the hyperbolic cosine of a number |
COUNT Counts how many numbers are in the list of arguments |
|
COUNTIF Counts the number of nonblank cells within a range that meet the given criteria |
COUNTA Counts how many values are in the list of arguments |
|
DEGREES Converts radians to degrees |
COVAR Returns covariance, the average of the products of paired deviations |
|
EVEN Rounds a number up to the nearest even integer |
CRITBINOM Returns the smallest value for which the cumulative binomial distribution is less than or equal to a criterion value |
|
EXP Returns e raised to the power of a given number |
DEVSQ Returns the sum of squares of deviations |
|
FACT Returns the factorial of a number |
EXPONDIST Returns the exponential distribution |
|
FACTDOUBLE Returns the double factorial of a number |
FDIST Returns the F probability distribution |
|
FLOOR Rounds a number down, toward zero |
FINV Returns the inverse of the F probability distribution |
|
GCD Returns the greatest common divisor |
FISHER Returns the Fisher transformation |
|
INT Rounds a number down to the nearest integer |
FISHERINV Returns the inverse of the Fisher transformation |
|
LCM Returns the least common multiple |
FORECAST Returns a value along a linear trend |
|
LN Returns the natural logarithm of a number |
FREQUENCY Returns a frequency distribution as a vertical array |
|
LOG Returns the logarithm of a number to a specified base |
FTEST Returns the result of an F-test |
|
LOG10 Returns the base-10 logarithm of a number |
GAMMADIST Returns the gamma distribution |
|
MDETERM Returns the matrix determinant of an array |
GAMMAINV Returns the inverse of the gamma cumulative distribution |
|
MINVERSE Returns the matrix inverse of an array |
GAMMALN Returns the natural logarithm of the gamma function, Γ(x) |
|
MMULT Returns the matrix product of two arrays |
GEOMEAN Returns the geometric mean |
|
MOD Returns the remainder from division |
GROWTH Returns values along an exponential trend |
|
MROUND Returns a number rounded to the desired multiple |
HARMEAN Returns the harmonic mean |
|
MULTINOMIAL Returns the multinomial of a set of numbers |
HYPGEOMDIST Returns the hypergeometric distribution |
|
ODD Rounds a number up to the nearest odd integer |
INTERCEPT Returns the intercept of the linear regression line |
|
PI Returns the value of pi |
KURT Returns the kurtosis of a data set |
|
POWER Returns the result of a number raised to a power |
LARGE Returns the k-th largest value in a data set |
|
PRODUCT Multiplies its arguments |
LINEST Returns the parameters of a linear trend |
|
QUOTIENT Returns the integer portion of a division |
LOGEST Returns the parameters of an exponential trend |
|
RADIANS Converts degrees to radians |
LOGINV Returns the inverse of the lognormal distribution |
|
RAND Returns a random number between 0 and 1 |
LOGNORMDIST Returns the cumulative lognormal distribution |
|
RANDBETWEEN Returns a random number between the numbers you specify |
MAX Returns the maximum value in a list of arguments |
|
ROMAN Converts an arabic numeral to roman, as text |
MAXA Returns the maximum value in a list of arguments, including numbers, text, and logical values |
|
ROUND Rounds a number to a specified number of digits |
MEDIAN Returns the median of the given numbers |
|
ROUNDDOWN Rounds a number down, toward zero |
MIN Returns the minimum value in a list of arguments |
|
ROUNDUP Rounds a number up, away from zero |
MINA Returns the smallest value in a list of arguments, including numbers, text, and logical values |
|
SERIESSUM Returns the sum of a power series based on the formula |
MODE Returns the most common value in a data set |
|
SIGN Returns the sign of a number |
NEGBINOMDIST Returns the negative binomial distribution |
|
SIN Returns the sine of the given angle |
NORMDIST Returns the normal cumulative distribution |
|
SINH Returns the hyperbolic sine of a number |
NORMINV Returns the inverse of the normal cumulative distribution |
|
SQRT Returns a positive square root |
NORMSDIST Returns the standard normal cumulative distribution |
|
SQRTPI Returns the square root of (number * pi) |
NORMSINV Returns the inverse of the standard normal cumulative distribution |
|
SUBTOTAL Returns a subtotal in a list or database |
PEARSON Returns the Pearson product moment correlation coefficient |
|
SUM Adds its arguments |
PERCENTILE Returns the k-th percentile of values in a range |
|
SUMIF Adds the cells specified by a given criteria |
PERCENTRANK Returns the percentage rank of a value in a data set |
|
SUMPRODUCT Returns the sum of the products of corresponding array components |
PERMUT Returns the number of permutations for a given number of objects |
|
SUMSQ Returns the sum of the squares of the arguments |
POISSON Returns the Poisson distribution |
|
SUMX2MY2 Returns the sum of the difference of squares of corresponding values in two arrays |
PROB Returns the probability that values in a range are between two limits |
|
SUMX2PY2 Returns the sum of the sum of squares of corresponding values in two arrays |
QUARTILE Returns the quartile of a data set |
|
SUMXMY2 Returns the sum of squares of differences of corresponding values in two arrays |
RANK Returns the rank of a number in a list of numbers |
|
TAN Returns the tangent of a number |
RSQ Returns the square of the Pearson product moment correlation coefficient |
|
TANH Returns the hyperbolic tangent of a number |
SKEW Returns the skewness of a distribution |
|
TRUNC Truncates a number to an integer |
SLOPE Returns the slope of the linear regression line |
|
|
SMALL Returns the k-th smallest value in a data set |
|
|
STANDARDIZE Returns a normalized value |
|
|
STDEV Estimates standard deviation based on a sample |
|
|
STDEVA Estimates standard deviation based on a sample, including numbers, text, and logical values |
|
|
STDEVP Calculates standard deviation based on the entire population |
|
|
STDEVPA Calculates standard deviation based on the entire population, including numbers, text, and logical values |
|
|
STEYX Returns the standard error of the predicted y-value for each x in the regression |
|
|
TDIST Returns the Student's t-distribution |
|
|
TINV Returns the inverse of the Student's t-distribution |
|
|
TREND Returns values along a linear trend |
|
|
TRIMMEAN Returns the mean of the interior of a data set |
|
|
TTEST Returns the probability associated with a Student's t-test |
|
|
VAR Estimates variance based on a sample |
|
|
VARA Estimates variance based on a sample, including numbers, text, and logical values |
|
|
VARP Calculates variance based on the entire population |
|
|
VARPA Calculates variance based on the entire population, including numbers, text, and logical values |
|
|
WEIBULL Returns the Weibull distribution |
|
|
ZTEST Returns the two-tailed P-value of a z-test |
Grading: 20 points for using each function, for example, ABS (returns the Absolute Value of a number which means "remove" the minus or plus sign, considering the number as a value in magnitude, not direction.) The absolute value of (-3) would, of course, be 3. In Excel, you would write =ABS(-3). The "=" sign says that you are starting a formula. All Excel formulas start with an "equal" sign.
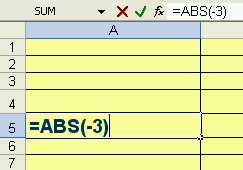
When you type =ABS(-3) into a cell, you are saying "return to me the absolute value of -3", then pressing the <Enter> key, the value of "3" appears. Try it now. If you can't get this to work, stop this lesson now, and contact your instructor!
If you can get this to work, you may proceed to do this for each of the functions listed below, do it on a spreadsheet, making it look like this example.
Let me know if any problems: joseph@auciello.net