CIS 700 Master QuizProf. Auciello's Virtual Classroom QuizRuns best using Internet Explorer
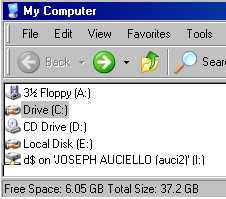
Q001:My Computer"My Computer" is another name for Windows Explorer that is a file manager that can rename, delete, cut, copy, paste, print, open, etc file and folders. It evolved from winfile.exe to Windows Explorer (explorer.exe) to My Computer. I wanted to know more about "My Computer" so I "google" and searched for "My Computer", and came up with an amazing number of "hits". 1. How many hits do you come up with when searching for "My Computer"? 2. Briefly describe how you searched. 3. Why should you put My Computer in quotes?
Answer each one in the form of 1. xxxxx,
etc. If you don't know the answer just type "will discover
later."
|
|
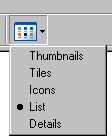
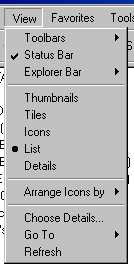
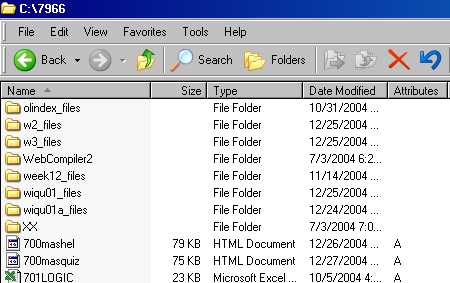
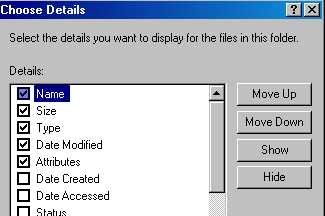
Q010: Customizing the Display Features
Note that this display lists (5) features (properties) of a file/folder: Name, Size, Type, Date Mod., Attributes.
It is a bit tricky, but try it. If you fail, I or someone will show you, and just write below: "Mr. A. Please show me how to do this."
If you can do it, describe the steps you took:
|
|
xxxQ011: GRADE.DOC. https://auciello.tripod.com/GRADE.DOCThis is the MASTER ASSIGNMENT LIST. Refer to it. Follow it. If you hit a project too hard, wait a while until your classmates have done it, and explained their technique in "701 MASTER HELP" https://auciello.tripod.com/701mashel.htm.txt Questions: (1) How else besides the projects on 'GRADE.DOC' can you earn points? (2) How can you use this form for help? State exactly how to do it. (3) I will reward the "front runners" with Letters of Recommendation -- If we all help each other in this way, is this approaching a "Virtual Learning Community"?
|
|
Q012: Getting points from the Master Help Form. 701mashel.htmTo help you along, I am now giving points like this -- 25t (for Mandatory Attendance-Checking In on Mon-Thurs) + 25mhx (where mhx designates an item on this form) + 25JA (helping a student with initials of JA) + 100xxx (xxx = name of project, like MAP). Questions: Explain these
lines:
0124,Young,Paul,03,07,08,650.(50
pvc-doc),hu17floor@aol.net How many questions
on the Master Help Form did Paul Young answer? What are the numbers of the
Questions? What does "mh" stand for? Is this a sneaky way for
Mr. A. to get you to use this form and get information from your
peers? Can you learn from your
classmates?
|
|
Q013: Using the VIRTUAL CLASSROOM click https://auciello.tripod.com/This page has two
key principles: Movement and Color. Images and Text are
scrolling (click on any image on top to see their home page), and it is
color-coded with the "701" info in Yellow. Look at the page now. Is it Page 1 or
Page 2? How do you get to Page 2? What color is the "ALL"
category? What color column is the email assignment in? How many points for submitting your email address?
What is the name and the html name of the Introductory Quiz? Why are
the Word Quiz 01 and Excel Quiz 02 worth 250 points? (No one in this class
has yet passed them yet with an 80 or above -- show me what you
know). Is the Space Science Test something that I co-developed with
Dr. Moreno? Name 3 links that are in the CIS 701 Topics
Column? What is the number of my Web Design
course?
|
|
Q014: Prof. Auciello's Virtual Classroom (page 2) click https://auciello.tripod.com/nextpg2.htmlWhat page number is
this? Does it have the same color coding as teh 1st Page? Do you like the
"light cream background? It takes a long time to load, (almost
impossible at 56K modem speeds) because it uses Java Applets, short Java
Programs that each have to individually load that it uses for the "hover"
buttons. If you can't load it, just pop in the CD and get it. The CD
contains the web site. Are the same programs that are on the web
site also on the CD? Why does the CD load faster? Take
"Required Quiz #1" if you think you need it for 50 points. How many pages
is 701-GLOSS? What is it about? Explain what you think the "Final
Projects" are?
|
|
Q015: Page 2 (continued)Open https://auciello.tripod.com/ and look at it while answering these questions.Note "701 Quiz 01"
click it. It covers much the same material. Take it if you like for
50 points. How many points does it say on the page? Click "701 Quiz
01a" -- What is the subject of this quiz? Click https://auciello.tripod.com/14tqm.html
and see the version with cartoons! The "701 Quizzes" are called "Web
Quizzes". How many 701 Quizzes are there? Do they help you
learn? The "Check-in" projects are also a kind of a help file.
How many "Check-in" DE Students lessons are there? Take these for 50
points each if you need to.
|
|
Q016: The "ALL" column on Page 2 click https://auciello.tripod.com/nextpg2.htmlName (2)
point-generating projects in the "ALL" column. Check out "Interview with
God", an insightful link sent by my daughter. She also sent
"Courtroom Humor" to me years ago. Check out all the links in this
column -- which ones do you like best? Check out "757 Slide Show"
and Cindy Liu's Home Page http://clovejoe.tripod.com/ Which
do you like best? Why? OK. enough "Prep" time. Let's start the
projects! Go!
|
|
Q017: Brochure (3 Fold) -- https://auciello.tripod.com/701out99.docDownload the above link. Understand the page numbers and how it folds. Figure out how to print on both sides. Understand that this is just a Table.
The 1st Row = 1st Page. The smaller columns are at the seams of the folds. A good Brochure communicates a message with High-Visual-Impact, with images and text reinforcing each other! It takes about 3 pages of text and images, so find a website, download and save about 3 pages of info to a WORD document. Plan your brochure, and working one column at-at-time, build it, saving as your go! Please describe below, step by step, exactly how you built your brochure, so that you can teach others. 50ec-3f pts for doing this.
1003f -- for printing it out. |
|
Q018: CR3.DOC - https://auciello.tripod.com/CR3.DOCCR3 is a 200-point project needs to be
printed out, and all the questions answered in pen. Some questions
have been answered. Answer them yourself anyway. Sign it, and
put in Project Notebook, which is turned in for a Final Grade the last
week of class. Explain how you did this project. |
|
Q019: BUSINESS CARD PROJECT https://auciello.tripod.com/buscard3.docTHIS IS SO IMPORTANT: TO WORK EFFECTIVELY IN TODAY'S BUSINESS-HI-TECH ENVIRONMENT, ONE HAS TO PRESENT HIM/HERSELF DIGITALLY! Business Cards with pictures, logos, email, web addresses, cell #, street addresses, etc. helps to define you! This is the only way to work in today's world, and is something that I feel strongly about teaching you! I put
the format of 10 business cards in a WORD by making a table of 2 columns
and 5 rows (3" * 2.5"). The technique is to work on, say,
the upper left cell, inserting an image (learn to wrap text around image),
and
My TA's, Herlin Guerra and Oswaldo Razo, took this even further by making the cards in Portrait Mode, and adding a colorful- watermarked background. This became "World Class"! https://auciello.tripod.com/buscard3.doc Please describe the steps you took in creating Business Cards, with attention to any "special" techniques that you took! Be Well. JA. Out.
|
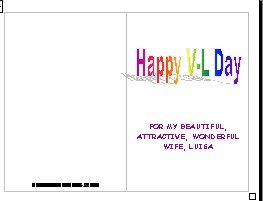
| Q020: Greeting Card Project. pages 4 & 1pages 2 & 3
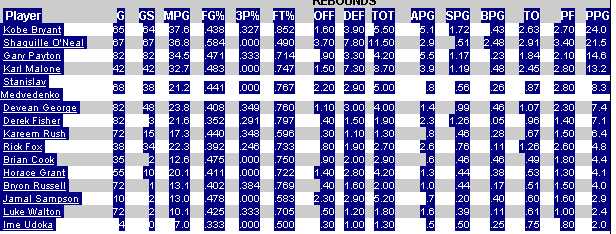
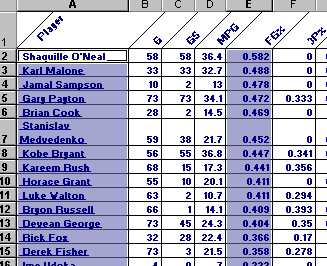
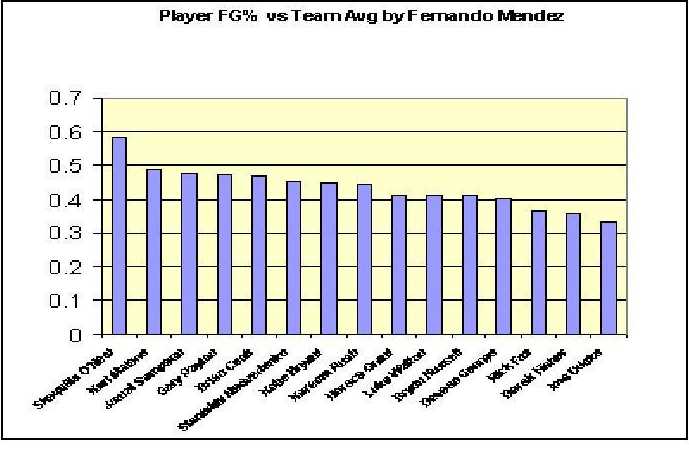
First of all -- If you "get" that the Spanish is "Fractured", give yourself 10 points. Second -- this is not the best card, most of my students have created cards that put mine to shame, but makes me proud of them! To do this assignment, and I am trying so hard here to put lessons OnLine for your, take a piece of paper, hold it landscape, like above, and mark it 4, 1 on the outside, and 2, 3 on the inside. Make sure that when you open it, you see 4, 1 outside, and 2, 3 on the inside. Then understand that this is a table, with almost invisible margins. (Pages 2, 3, are showing, right?). Put text and images (insert Clipart) on these pages. Showing outside pages (4, 1) TAKE A MINUTE AT THIS POINT TO ENSURE THAT YOU UNDERSTAND THE NUMBER OF EACH PAGE. LET ME ADD SOME "SMACK" HERE -- I AM FINDING OUT THAT HAVING GOOD RELATIONSHIPS, MADE BETTER BY AFFIRMING THEM, MAKES LIFE EASIER, AND INCREASES YOUR SUCCESS. SO MAKE LOTS OF GREETING CARDS. 50 POINTS FOR EACH PAGE. DO IT IN B+W FIRST, THEN EXTRA 100 IN COLOR. PLS EXPLAIN, IN DETAIL, BELOW, EXACTLY, THE STEPS YOU TOOK TO DO THIS PROJECT: Download the card format from the links above. Question: What are the steps to create the Greeting Card? ==============================================Q021: Lakers Statistical ProjectSteps are: (1) get Lakers Stats use Google or other search engine (100 pts). (2) Open Excel. (3) Highlight Stats, (4) Paste them to an Excel Sheet. (5) Sort by FG%. (6) Format sheet like #5 below (100 pts). (7) Using Chart Wizard, make a bar graph. (8) Copy and Paste (C and P) graph to Paint where you make the "Team Average" line using the line tool, and the words "Team Average" using the Text Tool. (9) C and P it to WORD, where you center it, and add text to the bottom, and print it. (200 pts). (400 pts total). Then of course enter it in the ATT/PART form as 400LAKERS. This project will develop some excellent computer skills! JA. This is written as the Playoffs begin in April 2004. The goal here is to develop Desktop Visual Information skills. (1-3) I expect you to be able to find "Stats" on the Official
Lakers Web 4) Paste it to Excel, corner A1.
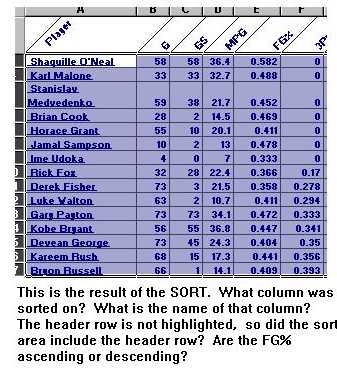
(5) Check it out! The data is not sorted. What an impending disaster. How could you make a clear graph unless the data is organized? How could you visually represent data clearly unless it first is organized? We have to "SORT" the data. Note that the
(6) Formatting the Sheet. Click the "Select All" cell in the corner. With the "Format" toolbar enabled, ("fill color" with white, then "Format Cells" put cell borders. Then use "Cell Alignment" to align the column headers as shown above (5): (7) Making a Bar Graph: The best method is to click on the
Chart Wizard (CW). But what if your Excel
The trick is to highlight the data columns, by dragging the mouse over each one while holding the "Ctrl" key down, allowing multiple highlighting. Repeat after me ... "Select the Player and his corresponding FG% by dragging carefully down each column while holding the Ctrl Key down!" (This is how to get data in non-adjacent columns into the CW. If you are worrried, that the FG% for Shaq is not highlighted, kudo yourself. It actually is, but does not show it. Also, note col "F", FG%, is sorted in descending order.
(8 - 9). The final product -- on a World Class Presentation Quality Level befitting the Lakers -- has the Chart Area filled with color, the Name Category aligned at 45%, is elongated along the height dimension to make the differences in the FG% more distinct, and using 'Paint' the Team Average Line and Caption are inserted. C and P this image to Paint, where the Team Average (find this number) is drawn by the line tool, and its caption is written using the Text Tool, then save it. Finally, insert this image to WORD where you center it, and add text to the bottom. Print it out. Log 400 points on the A/P form, 400LAKERS. ... Additional notes from Prof. A.: This document vividly communicates! Pictures are worth 1000 words: Enhanced pictures speak thousands of words! This is truly a World-Class assignment, a vital tool to have in your skill set portfolio. Make this happen. Put in your notebook for me to see! JA. Out.
The following explanation was provided by Herln Guerra, Prof. Auciello's T.A. 701
Lakers Project. By
creating this project you will not only have fun working for the Lakers,
also you will learn some of the most common and useful tasks to work with
Microsoft Excel, the Microsoft software that can be used to compute
calculations, accounting and create interactive charts.
The first thing to know when you are working with a computer (today
in 2004) is that you don’t have to worry if you have done something
wrong. The operating systems
that computers use nowadays come with a feature which let users fix any
problems by “restoring the system” to a certain day.
So, for example, you find out that you have done something wrong to
your computer today you can restore it to yesterday functionality and
everything will be OK again. (Note
that your files will not change or be lost, the only thing that is
“restored” are the operating system files).
Similarly, with the Microsoft Suit (Word, Excel, Power Point,
Access and Outlook) there is the function called “Undo” which is
represented by an arrow that indicates “to go back.”
If you do something wrong while working in any of Mr. A’s
project, don’t worry, you just have to click this button and everything
will be back to normal. The
function is found in the “menu bar” in the “Edit” option and its
name is “Undo.” Then,
play around with the programs until you understand the functions.
Back to the Lakers Project!
Basically the project is about copying, modifying and outputting in
form of a chart the data that is found in the following website: http://www.nba.com/lakers/ When in the website,
you will see a left-hand menu in which one of the options is “Stats”
(short for Statistics). This
is the link you want to click to start the project.
Now that you are in the page, we will start the steps of copying/pasting your data:
YOUR DATA SHOULD NOW LOOK,
IF NOT EXACTLY LIKE MR. A’s, ALMOST THE SAME.
You are done with this part. We
need to create the Graph.
That
is all for this project. -- END OF THOROUGH, COMPLETE LESSON BY HERLIN GUERRA. -- Describe the steps necessary in detail to produce the document above.
|
| |
| |
 The
word "Exploring" is an attempt at humor, referring to My Computer's roots.
The
word "Exploring" is an attempt at humor, referring to My Computer's roots.
 The
Status Bar, at bottom of desktop shown at the right, describes what
is occurring. Why it's called "Status Bar", of course.
The
Status Bar, at bottom of desktop shown at the right, describes what
is occurring. Why it's called "Status Bar", of course.
 text info, artistically and clearly communicating. Then copy
that cell to the next column, then copy the entire row to the next row,
and so on. Putting this on glossy photo paper really takes this
"up a notch".
text info, artistically and clearly communicating. Then copy
that cell to the next column, then copy the entire row to the next row,
and so on. Putting this on glossy photo paper really takes this
"up a notch". 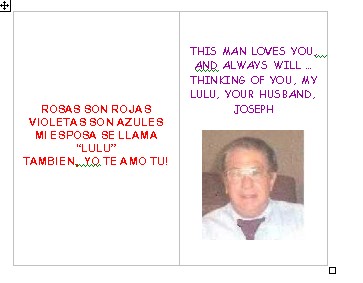
 Site, then please highlight them as a "block of data"
. a rectangle. From "Player" upper left to the entry in the bottom
rights. If you can't find them, click
Site, then please highlight them as a "block of data"
. a rectangle. From "Player" upper left to the entry in the bottom
rights. If you can't find them, click 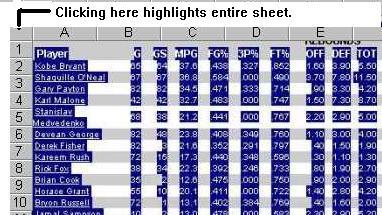
 data is
sorted below. To sort, click "Data", and try to figure it out
/ "hack" it by following the prompts and your imagination and
intuition. (These programs are engineered to for you to use logic
and intuition. ) If you are stuck, come see me .
data is
sorted below. To sort, click "Data", and try to figure it out
/ "hack" it by following the prompts and your imagination and
intuition. (These programs are engineered to for you to use logic
and intuition. ) If you are stuck, come see me .  Program does not
have this button or icon showing on the Toolbar? So, now you
have to do some 'discovery' or 'hacking' .... There are toolbars at the
top of the screen. They are accessible through the View Tab on the
File Toolbar, the top toolbar. Go "Hack" at it. Turn
various Toolbars on and off, to help you understand them.
Usually, the Chart Wizard button comes on as part of the Standard
Toolbar. The first time it didn't for me; but by turning it off and
on, it appeared on my Standard Toolbar. CW is a tool on the
Standard Toolbar. Hack away until it appears by enabling / disabling
Toolbars thru the View Tab (right after File, Edit).
Program does not
have this button or icon showing on the Toolbar? So, now you
have to do some 'discovery' or 'hacking' .... There are toolbars at the
top of the screen. They are accessible through the View Tab on the
File Toolbar, the top toolbar. Go "Hack" at it. Turn
various Toolbars on and off, to help you understand them.
Usually, the Chart Wizard button comes on as part of the Standard
Toolbar. The first time it didn't for me; but by turning it off and
on, it appeared on my Standard Toolbar. CW is a tool on the
Standard Toolbar. Hack away until it appears by enabling / disabling
Toolbars thru the View Tab (right after File, Edit). 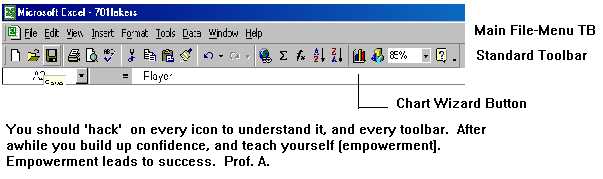
 Follow the prompts from the CW until you
have a graph that looks like this. Each graph has its own
"areas" or sub-sections such as: Chart area, category, legend,
title, etc that can be accessed and modified by right-clicking (r-c) on
them. For example to modify the Category Area, r-c on it,
Format Axis, etc to achieve the alignment of the names. Hack it.
Follow the prompts from the CW until you
have a graph that looks like this. Each graph has its own
"areas" or sub-sections such as: Chart area, category, legend,
title, etc that can be accessed and modified by right-clicking (r-c) on
them. For example to modify the Category Area, r-c on it,
Format Axis, etc to achieve the alignment of the names. Hack it.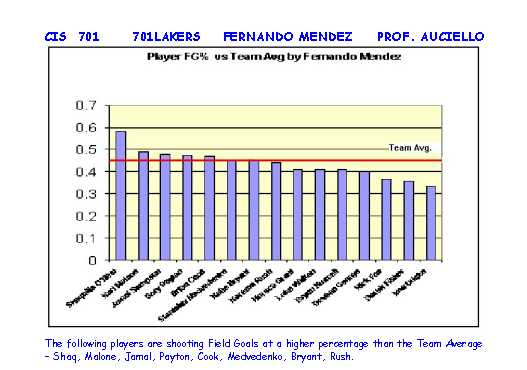